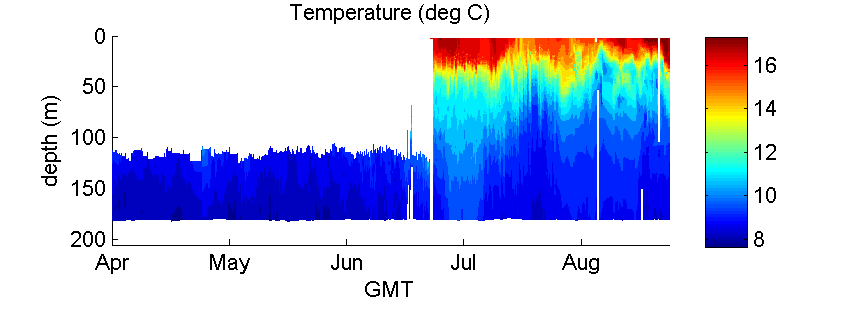
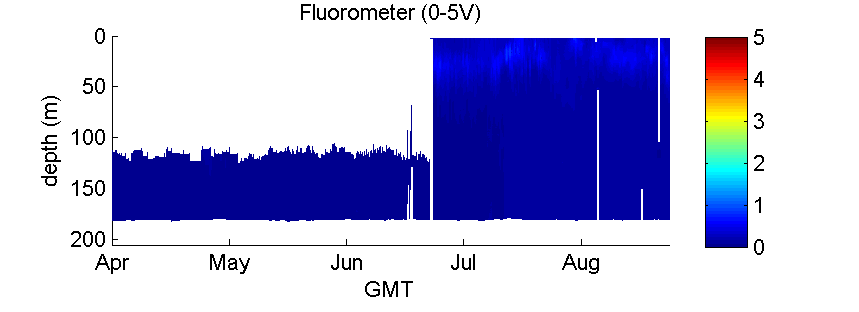
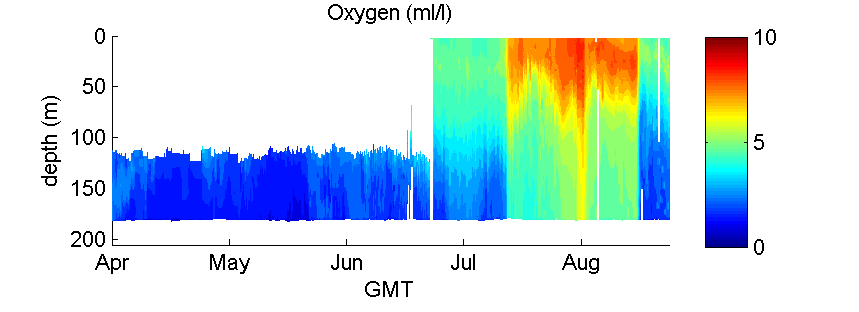
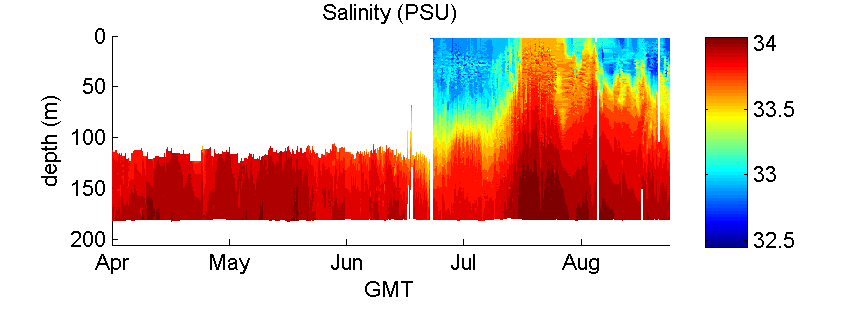
These plots came from the data recovered post-deployment from the SeaHorse Vertical Profiler. The deployment data were collected from April through September 2007.
These show preliminary, raw data from the profiler, and have not been quality controlled in any way. (For example, the time axis on the science plots is mislabelled, just haven't chased that bug down yet.) Work is continuing on post-processing of this data.
Data presentation work is by John Graybeal; contact him with questions or requests about this data processing. The profiler work was managed by Andy Hamilton, Brian Kieft, and Mark Chaffey. Contact them with questions about the profiler deployment.
These plots are autoscaled to browser window size; click on a plot to see the full-size version.
Science plots were produced by a combination of matlab scripts and Perl scripts. No attempt has been made yet to validate the plots or improve their appearance/format, but this will be done once a few more diagnostic plots have been created.
These engineering plots were created by Perl and Ferret scripts. Unless otherwise raised, these are considered the desired engineering plots.
The 3 plots show the vertical range of the profiler, its velocities going up (profiling) and down (return), and its the battery charge.