OASIS ADCP Data Regridding Example
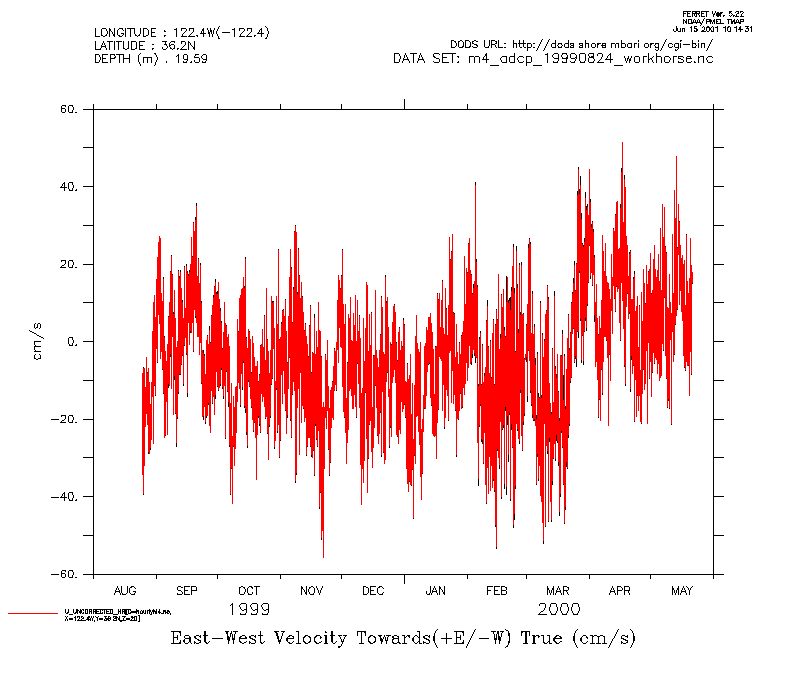
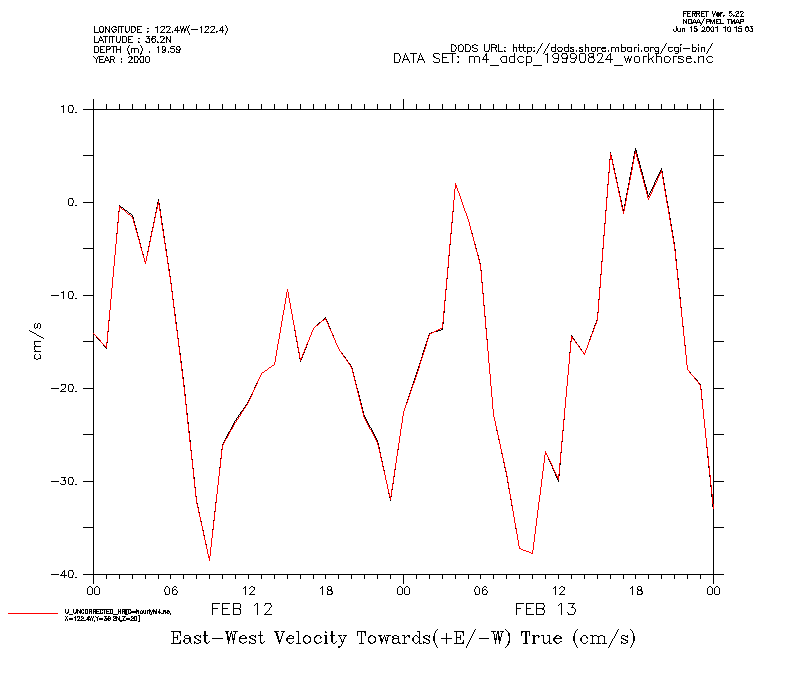
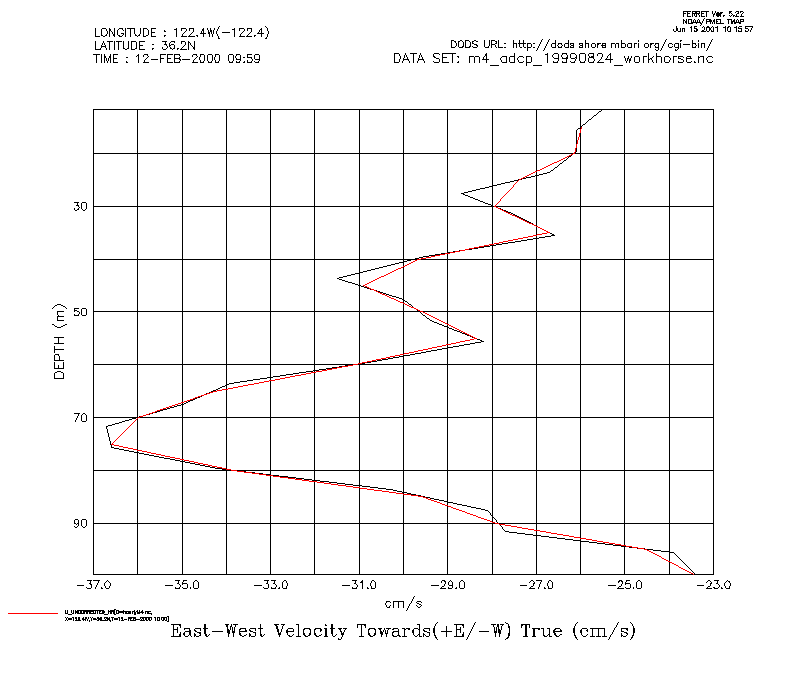
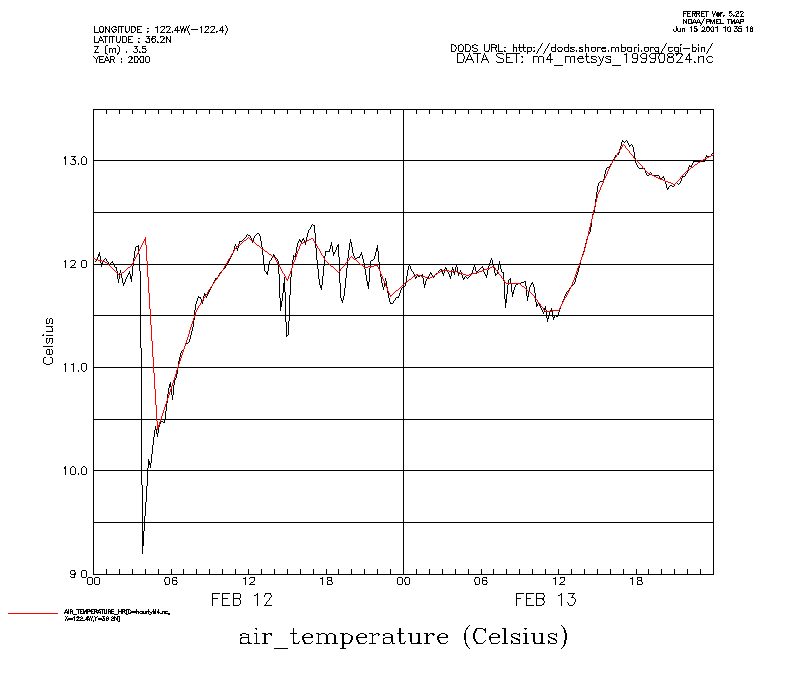
The hourly data sets have the data averaged in time to one hour intervals and
interpolated to 5 meter bins. Below are the Ferret commands to load the orignal ADCP data
set and the gridded data set and the plotting commands to create the graphics. The black
lines are the original data and red lines are the gridded data.
use "http://dods.shore.mbari.org/cgi-bin/nph-nc/data/OASISdata/netcdf/hourlyM4.nc"
use "http://dods.shore.mbari.org/cgi-bin/nph-nc/data/OASISdata/deployments/m4/199908/m4/netcdf/m4_adcp_19990824_workhorse.nc"
plot/z=19.593 U_COMPONENT_UNCORRECTED
plot/z=19.593/ov U_UNCORRECTED_HR[d=1]
frame/file=timeAvg1.gif
 plot/z=19.593/t=12-feb-2000:14-feb-2000 U_COMPONENT_UNCORRECTED
plot/z=19.593/t=12-feb-2000:14-feb-2000/ov U_UNCORRECTED_HR[d=1]
frame/file=timeAvg2.gif
 go graticule
plot/t="12-feb-2000 10:00"/z=0:100 U_COMPONENT_UNCORRECTED
plot/t="12-feb-2000 10:00"/z=0:100/ov U_UNCORRECTED_HR[d=1]
frame/file=depthInt1.gif
The effect of the hourly averaging is not evident for the ADCP data as the original
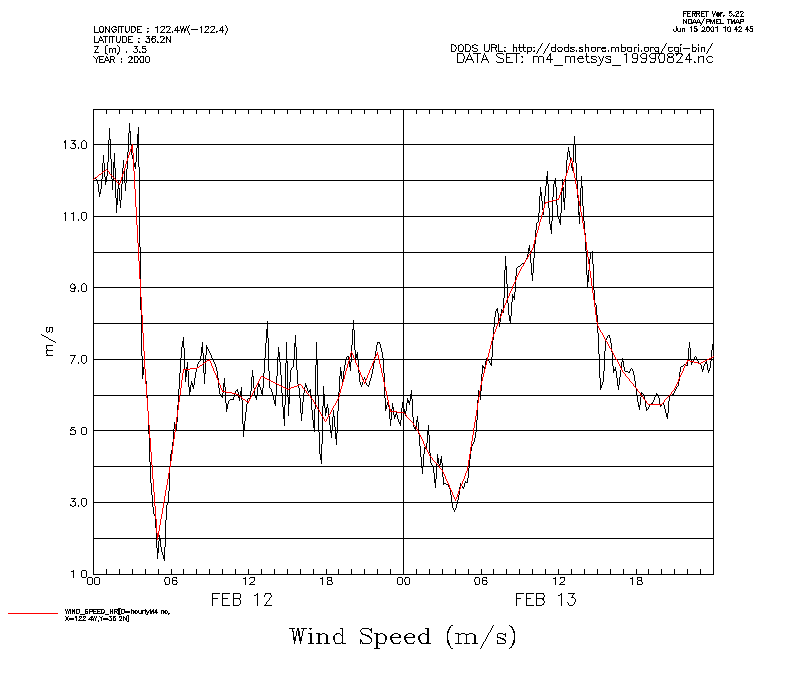
data have a time interval of one hour. Let's load the original metsys data for this
deployment and examine the averaging of air temperature and wind speed for the same 2 day
period.
use "http://dods.shore.mbari.org/cgi-bin/nph-nc/data/OASISdata/deployments/m4/199908/m4/netcdf/m4_metsys_19990824.nc"
plot/t=12-feb-2000:14-feb-2000 AIR_TEMPERATURE
plot/t=12-feb-2000:14-feb-2000/ov AIR_TEMPERATURE_HR[d=1
frame/file=timeAvg3.gif
plot/t=12-feb-2000:14-feb-2000 WIND_SPEED
plot/t=12-feb-2000:14-feb-2000/ov WIND_SPEED_HR[d=1]
frame/file=timeAvg4.gif
 plot/z=19.593/t=12-feb-2000:14-feb-2000 U_COMPONENT_UNCORRECTED
plot/z=19.593/t=12-feb-2000:14-feb-2000/ov U_UNCORRECTED_HR[d=1]
frame/file=timeAvg2.gif
 go graticule
plot/t="12-feb-2000 10:00"/z=0:100 U_COMPONENT_UNCORRECTED
plot/t="12-feb-2000 10:00"/z=0:100/ov U_UNCORRECTED_HR[d=1]
frame/file=depthInt1.gif


